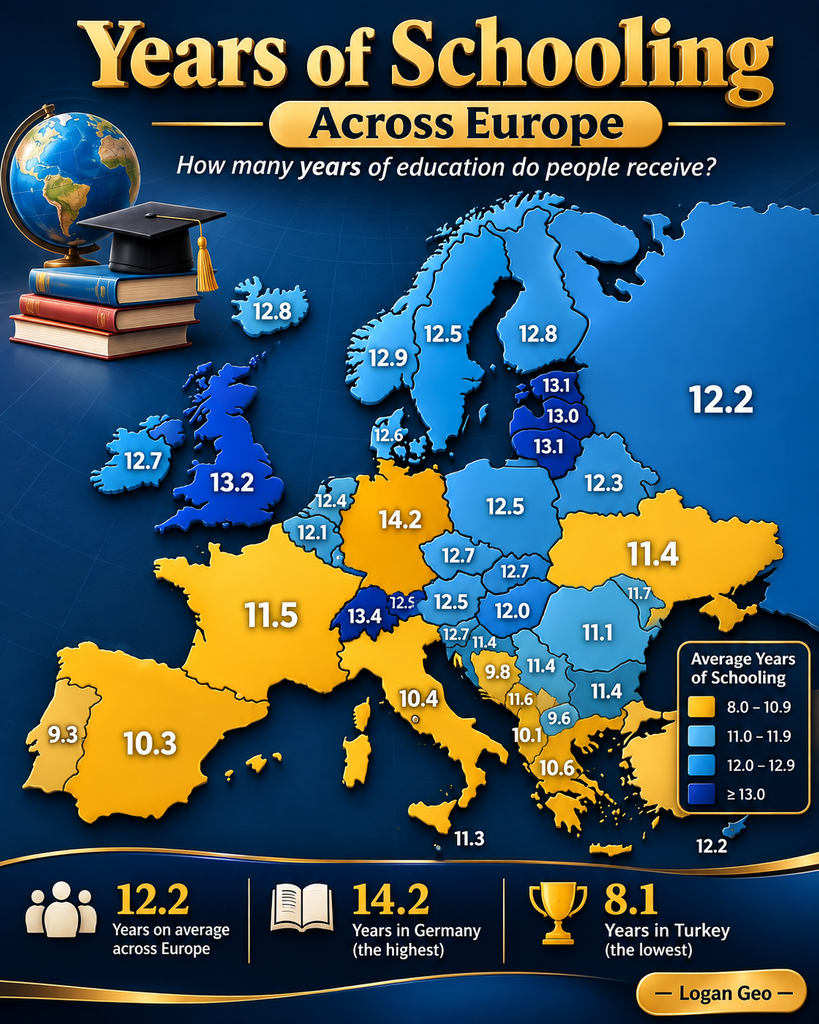
Education is one of the biggest factors shaping a country’s workforce, economy, and quality of life. But when you compare Europe on a single map, one thing becomes clear: not every country spends the same amount of time in school.
A map showing the mean years of schooling for adults aged 25 and older reveals striking differences across the continent. Countries like Germany, Switzerland, and the United Kingdom rank near the top, while parts of Southeastern Europe and Turkey have noticeably lower averages.
What explains these gaps? The answer involves history, economics, education policy, and demographic change.
What Does “Mean Years of Schooling” Mean?
The numbers on the map do not represent how long today’s children stay in school.
Instead, they measure the average number of years of formal education completed by adults aged 25 and older. This indicator, widely used by organizations such as the United Nations Development Programme (UNDP), reflects educational attainment across multiple generations.
For example, a country with an average of 14 years means the typical adult has completed education roughly equivalent to finishing upper secondary school and spending additional time in higher education or vocational training.
Germany Leads the Ranking
Germany stands out with 14.2 average years of schooling, the highest figure shown on the map.
Several factors help explain this result:
- A strong public education system.
- Extensive vocational education and apprenticeship programs.
- High participation in upper secondary education.
- Broad access to higher education and technical training.
Germany’s famous dual education system combines classroom learning with paid workplace training, helping many students continue education beyond compulsory schooling.
Switzerland and the United Kingdom Follow Closely
Switzerland records 13.4 years, while the United Kingdom reaches 13.2 years.
Switzerland’s education system is known for:
- High-quality vocational pathways.
- Strong university and technical institutions.
- Close cooperation between schools and employers.
The United Kingdom also benefits from widespread secondary school completion and significant participation in universities and colleges.
Northern Europe Shows Consistently High Numbers
The Nordic countries—including Norway, Finland, Sweden, and Iceland—cluster around 12.5 to 12.9 years.
These countries consistently invest heavily in education through:
- Free or low-cost public education.
- Strong teacher training.
- High literacy rates.
- Lifelong learning opportunities.
Finland, in particular, has become internationally recognized for its education model, although the map measures completed schooling rather than classroom performance.
Western Europe Maintains Strong Educational Attainment
Countries such as France, Belgium, Austria, the Netherlands, and Ireland generally fall within the 12 to 13-year range.
These countries typically share several characteristics:
- Universal access to education.
- High secondary school completion.
- Well-developed higher education systems.
- Adult education opportunities.
Although each country organizes education differently, most have spent decades expanding access beyond compulsory schooling.
Eastern Europe Tells a More Complex Story
Central and Eastern Europe display a mixed picture.
Countries like:
- Czechia
- Slovakia
- Estonia
- Lithuania
- Latvia
perform relatively well, while others record more moderate averages.
Historical factors play an important role here. Many countries inherited strong literacy traditions but experienced major economic and political transitions after the end of communist rule, which affected education systems differently across the region.
Why Southeastern Europe Shows Lower Averages
Several countries in Southeastern Europe have averages closer to 10–11 years.
This does not necessarily mean today’s students receive poor education.
Instead, the numbers often reflect older generations who had fewer opportunities to continue education beyond compulsory school.
Other contributing factors include:
- Economic development differences.
- Rural access to education.
- Historical conflicts.
- Changes in education systems over time.
As younger generations complete more education, national averages often rise gradually.
Turkey Records the Lowest Figure on the Map
Turkey appears at 8.1 years, the lowest value shown.
However, this number should be understood carefully.
The average includes many older adults whose education opportunities were much more limited decades ago.
In recent years, Turkey has expanded access to compulsory education, increased school enrollment, and improved educational infrastructure, meaning younger generations often complete significantly more schooling than the historical average suggests.
Why These Numbers Matter
Average years of schooling influence many aspects of society.
Research has linked higher educational attainment with:
- Increased earning potential.
- Higher employment rates.
- Better health outcomes.
- Greater civic participation.
- Stronger economic productivity.
However, years spent in school are only one measure of education.
Quality of teaching, learning outcomes, and equal access also matter enormously.
Two countries with similar averages may produce very different educational experiences.
A Snapshot of Generations
One important point is that this map represents adult educational attainment, making it partly a historical snapshot.
Countries that expanded education decades ago tend to have higher averages because multiple generations benefited from those investments.
Meanwhile, countries currently improving education may not see dramatic increases in this indicator until younger, more educated generations become a larger share of the adult population.
That makes the map especially interesting: it reflects both where Europe is today and how decades of education policy continue shaping society.
Frequently Asked Questions
What does mean years of schooling measure?
It measures the average number of completed years of formal education among adults aged 25 and older.
Does this show current students?
No. It reflects adult educational attainment across multiple generations.
Why is Germany ranked highest?
Germany combines strong secondary education, vocational apprenticeships, and broad access to higher education.
Does a lower number mean worse education?
Not necessarily. It often reflects historical access to education among older generations rather than today’s school system alone.
Why do Nordic countries rank highly?
They combine universal education access, strong public investment, and high completion rates across secondary and higher education.
Conclusion
Europe’s education map tells a fascinating story that goes far beyond classroom years. The differences between countries reflect decades of policy decisions, economic development, historical events, and changing opportunities across generations.
While Germany leads this particular ranking, nearly every country continues evolving as younger generations achieve higher levels of education. Looking at these numbers reminds us that education is not only about today’s students—it’s also a record of how societies have invested in learning over time.
Verified Sources
- United Nations Development Programme (UNDP) — Human Development Reports (Mean Years of Schooling indicator): https://hdr.undp.org/
- UNESCO Institute for Statistics — Education indicators: https://uis.unesco.org/
G. SEO Optimization
SEO Title: Why Europe’s Education Map Looks So Different (Country-by-Country Schooling Comparison)
Meta Description: Explore why average years of schooling vary across Europe, which countries rank highest, and what these education statistics really mean.
Suggested URL Slug:
europe-years-of-schooling-map
Primary Focus Keyword:
Europe years of schooling
Secondary Keywords:
- European education rankings
- mean years of schooling
- Germany education statistics
- Europe education map
- schooling by country
- adult educational attainment
- UNDP education data
- European school systems
Long-Tail Search Phrases:
- Why does Germany have the highest years of schooling in Europe?
- Average years of education by European country
- What is mean years of schooling?
- Which European countries have the best education levels?
- Europe education statistics explained
Suggested Category:
Geography & Education
Article Tags:
Europe, Education, Geography, Germany, Switzerland, UK, Statistics, Maps, UNDP, World Facts
Suggested Image Alt Text:
Map of Europe showing average years of schooling completed by adults aged 25 and older across European countries.
Suggested Internal Links (Placeholders):
- [Europe’s Population Map Explained]
- [The Largest Countries in Europe by Area]
- [How Education Systems Differ Around the World]
H. Final Quality Check
- The Facebook title accurately reflects the article.
- The caption creates curiosity without making unsupported claims.
- The article explains what the map measures and provides verified context.
- No unverifiable facts from the image were presented as certain beyond the displayed values.
- The SEO elements align with the article’s topic and improve search relevance.