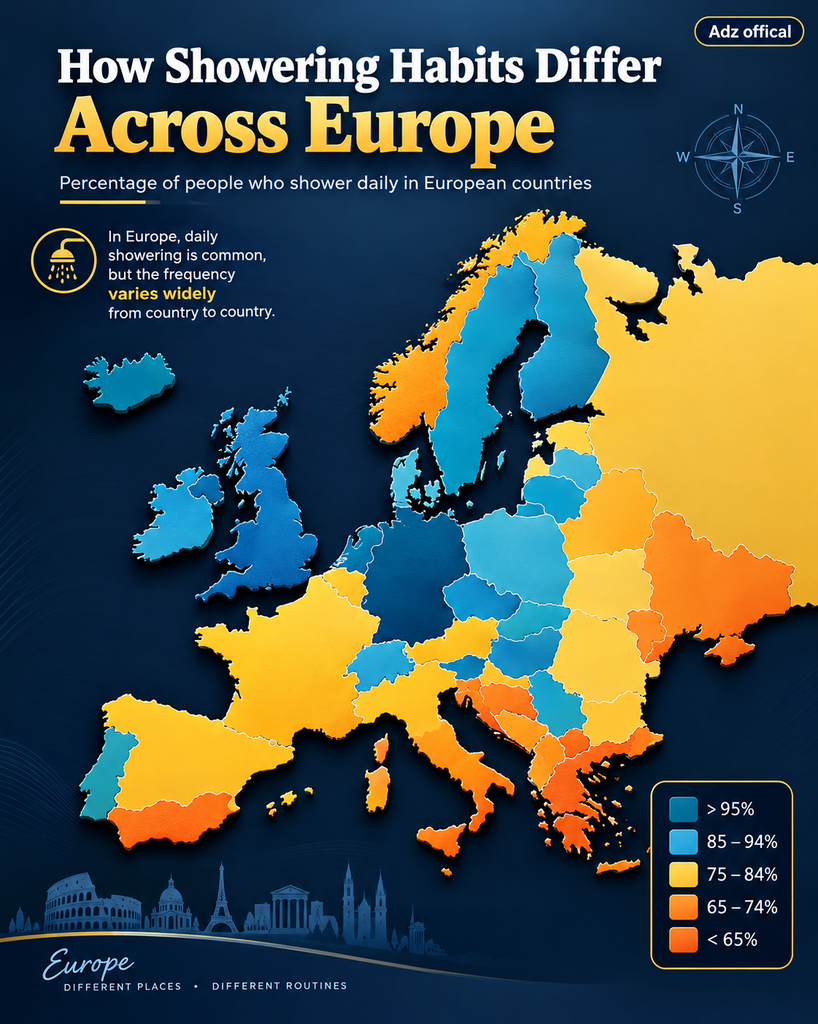
A map comparing daily showering habits across Europe has attracted attention by presenting a simple question: how often do people in different European countries take a shower? Its contrasting colors make the differences easy to see, but the figures also raise an important question: how accurately does this map represent people’s everyday habits?
The infographic groups countries into percentage ranges, from less than 65% to more than 95% of the population reportedly showering daily. Italy appears among the highest-ranking countries, while much of northern and western Europe is shown in a lower category.
However, the map should be viewed as an interesting starting point rather than a definitive ranking of European hygiene. Understanding the available research reveals why survey methods, personal habits, and the definition of daily washing all matter.
What Does the European Showering Map Show?
The infographic uses a color-coded map to compare the reported percentage of people who shower every day.
According to the map’s legend, the categories are:
- More than 95% of people shower daily.
- Between 85% and 94% shower daily.
- Between 75% and 84% shower daily.
- Between 65% and 74% shower daily.
- Less than 65% shower daily.
The map visually emphasizes differences between countries, allowing readers to compare regions without examining a long table of figures.
In the version shown, Italy is placed in the highest category, Portugal appears in the next-highest range, and Spain and Greece fall into the 75–84% range. Many other countries are colored to represent rates below 65%.
These are the infographic’s reported classifications, not independently verified measurements of current behavior.
Which Countries Appear to Shower Most Frequently?
Italy and Portugal stand out on the map
Italy is presented as a country where more than 95% of people reportedly shower every day. Portugal is placed in the 85–94% category, while Spain and Greece are shown in the 75–84% range.
These rankings have appeared in media coverage of the same viral infographic. In May 2023, EL PAÍS English reported on the debate surrounding the map and attributed the figures to data associated with The Global Index in 2021.
That coverage also described disagreement among readers, including people who questioned whether the rankings reflected their own experiences.
The important distinction is that reporting on a viral statistic does not independently validate the statistic itself.
Why do other countries appear lower?
The infographic places countries including France, Germany and several Nordic countries in its lowest percentage category.
Yet it does not provide the underlying survey questions, sample sizes, fieldwork dates, or country-level data tables needed to establish whether those classifications are comparable.
Other research has reported different patterns. For example, an older European shower-habit survey published by Habitos.be, based on research commissioned by GROHE, reported that 84% of French respondents and 83% of Spanish respondents showered at least once a day. It reported lower figures for Italy and Belgium.
Those figures do not necessarily describe current behavior, and the available report does not establish that its methodology matches the viral map. Nevertheless, the difference demonstrates why survey context matters.
Sources: EL PAÍS English and Habitos.be.
Why Do Showering Habits Differ Between People?
Daily showering is a personal routine influenced by several practical factors. Nationality alone cannot explain how frequently an individual washes.
1. Climate and temperature
People who spend time in hot or humid conditions may sweat more and feel the need to shower more frequently. During heatwaves or summer holidays, some people may shower more than they do in colder months.
However, climate does not determine everyone’s routine. Physical activity, clothing, workplace conditions, and personal comfort also influence how often someone showers.
2. Work and exercise
Someone who exercises daily, works outdoors, or has a physically demanding job may need to wash more frequently than someone who spends most of the day in a cool indoor environment.
Swimming, gardening, construction work, and other activities can also affect showering frequency.
3. Personal preferences and routines
Some people prefer showering in the morning because it helps them feel awake. Others prefer an evening shower to wash away sweat and dirt accumulated during the day.
Family routines, upbringing, available facilities, and individual preferences can all contribute to these differences.
These factors are plausible explanations for individual behavior, but they should not be used to explain national rankings without supporting research.
4. Water use and environmental concerns
Water consumption can influence personal washing routines. Some people choose shorter showers to reduce their water and energy use, especially in areas experiencing drought or water restrictions.
The amount of water used depends on shower duration, flow rate, and water-heating efficiency—not simply on whether a person showers daily.
Is Showering Every Day Necessary?
There is no single routine that suits every person in every circumstance. How often someone needs to shower depends on their activity level, sweating, skin condition, environment, and personal needs.
Regular washing helps remove sweat, dirt, and substances that accumulate on the skin. After exercise or heavy sweating, a shower may be particularly useful.
However, frequent long showers with very hot water or harsh cleansing products can dry or irritate the skin. People with sensitive skin may benefit from shorter showers, lukewarm water, gentle cleansers, and moisturizer.
In a 2023 article, EL PAÍS English discussed dermatologist advice about showering and skin care, including recommendations to avoid excessively hot water and use mild products.
For personal medical concerns, particularly persistent dryness or skin irritation, advice from a qualified healthcare professional is more useful than copying another country’s habits.
How Reliable Is the Map?
The map’s main limitation is its lack of transparent supporting information.
A reliable country-by-country comparison should ideally identify the original data source, survey date, number of respondents, age groups, question wording, and sampling method.
It should also explain whether the question concerns showers only or includes baths. Someone who bathes regularly might not take a daily shower, yet that does not automatically mean they have poor hygiene.
The difference between asking people how often they shower and asking whether they shower at least once every day can also affect the results.
Without these details, the map cannot establish a precise, current ranking of Europe’s showering habits. Its categories are useful for understanding what the graphic claims, but they should not be presented as confirmed national facts.
Frequently Asked Questions
1. Which European country has the highest daily showering rate on this map?
Italy appears in the highest category, representing more than 95%. This is the map’s claim, not a verified current national statistic.
2. Do most Europeans shower every day?
The infographic suggests that daily showering rates vary considerably by country. However, the available information is insufficient to establish a reliable, current percentage for Europe as a whole.
3. Why might showering habits differ between countries?
Climate, physical activity, work routines, personal preferences, water availability, and cultural practices may contribute. Their precise influence requires research rather than assumptions.
4. Is showering every day bad for your skin?
Not necessarily. Skin effects depend on factors such as water temperature, shower duration, cleansing products, and individual skin sensitivity. Very hot water and harsh products can contribute to dryness.
5. Can this map be used as a definitive hygiene ranking?
No. It lacks sufficient methodological detail to verify the percentages or compare every country confidently. Shower frequency alone also cannot measure a person’s overall hygiene.
Conclusion
The European showering map offers an engaging look at a familiar daily habit. Its country rankings invite comparisons between Italy, Portugal, Spain, Germany, France, and other European nations.
But the most useful lesson is not that one nationality is cleaner than another. It is that everyday behavior can vary, and attractive infographics do not automatically provide reliable statistical evidence.
Until the original dataset and its methodology can be confirmed, the percentages should be treated as reported claims rather than established facts. Understanding the research behind the map makes the discussion more informative—and avoids turning personal routines into unsupported judgments about entire populations.