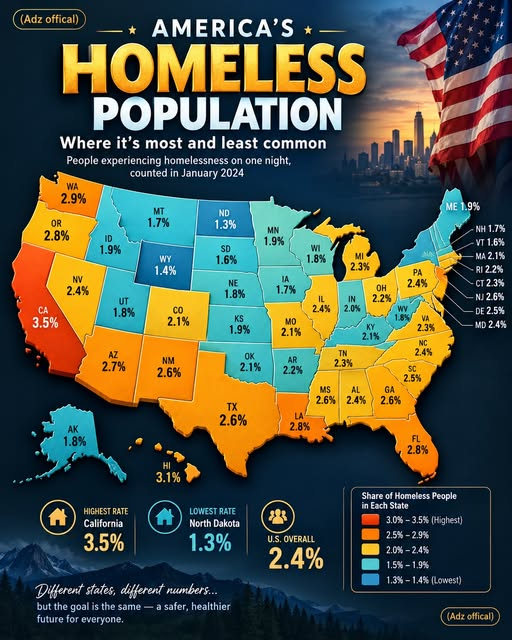
Homelessness is a challenge affecting communities throughout the United States, from major cities to smaller towns and rural areas. But the scale of the problem varies considerably across the country. A state-by-state look at homelessness data offers an important starting point for understanding where the need is greatest, how the situation differs between regions, and why reliable information matters.
According to the U.S. Department of Housing and Urban Development (HUD), 771,480 people were experiencing homelessness on a single night in January 2024. This was the highest total recorded in HUD’s point-in-time series at that time and represented an 18.1% increase from 2023. The findings highlight the continuing challenges surrounding housing affordability, access to shelter, and housing stability. Source: HUD’s 2024 Annual Homelessness Assessment Report.
What the 2024 Homelessness Numbers Show
HUD’s annual point-in-time count provides a snapshot of people experiencing homelessness during a single night, generally during the last ten days of January.
The count includes people staying in emergency shelters, safe havens, and transitional housing, as well as people living in places not intended for human habitation, such as vehicles, sidewalks, or abandoned buildings.
Of the 771,480 people counted nationwide, 497,256 were in sheltered settings and 274,224 were unsheltered. These figures show that homelessness is not limited to people sleeping outdoors. Many people also depend on temporary accommodation while facing uncertainty about where they will live next.
The 2024 total was 118,376 higher than the 2023 count. HUD reported that the overall increase included a substantial rise in the sheltered population, while unsheltered homelessness also increased.
These figures describe a specific point in time. They should not be interpreted as the total number of people who experienced homelessness at any point throughout the year.
Which States Had the Highest Numbers?
California and New York recorded the largest numbers of people experiencing homelessness in 2024.
California counted 187,084 people, while New York counted 158,019. Together, the two states accounted for a substantial share of the national total.
Other states with large counts included Florida, with 31,362 people; Washington, with 31,554; and Massachusetts, with 29,360. Texas recorded 27,987, while Illinois counted 25,832.
These figures show where the largest numbers were recorded, but population size matters when comparing states. A state with a large population may have a higher total count than a smaller state even when its rate of homelessness is lower.
That is why absolute totals and population-adjusted rates should be considered separately.
Why Population Rates Matter
A population-adjusted rate provides a different way to understand homelessness. Rather than simply counting people, it measures the number experiencing homelessness relative to the size of the state’s population.
HUD reported approximately 23 people experiencing homelessness per 10,000 residents nationwide in 2024. California’s rate was approximately 48 per 10,000, while New York’s was approximately 81 per 10,000.
These rates help explain why state rankings can change depending on the measure being used. A state may have a relatively small total but a high rate when compared with its population.
For readers studying a homelessness map, it is therefore important to check the legend carefully. A map showing total people, people per 10,000 residents, and percentages of people living unsheltered is presenting three different measurements.
Confusing these measures can lead to inaccurate conclusions about which states face the greatest challenges.
What Contributes to Homelessness?
Homelessness rarely has a single cause. HUD’s 2024 report identifies several pressures associated with the national increase, including shortages of affordable housing, rising inflation, stagnant wages among lower- and middle-income households, and the effects of natural disasters.
Housing costs are particularly important. When rent and basic living expenses consume a large share of a household’s income, even an unexpected medical bill, job loss, or family emergency can make it difficult to remain housed.
Other circumstances can also contribute, including domestic violence, disability, limited access to support services, and the loss of temporary financial assistance.
The combination of these pressures differs by community. Local housing markets, available shelter capacity, disaster impacts, and the ability of service providers to connect people with stable accommodation can all influence the numbers recorded in a particular area.
The national report provides context, but the point-in-time figures alone cannot determine exactly how much each factor contributed in every state.
Sheltered and Unsheltered Homelessness
Another important distinction is whether people are sheltered or unsheltered.
Sheltered homelessness includes people staying in emergency shelters, safe havens, or transitional housing programs. Unsheltered homelessness refers to people staying in locations not meant for regular human habitation.
In 2024, roughly 64.5% of people counted nationally were sheltered, while 35.5% were unsheltered.
These categories matter because communities have different levels of shelter availability and different housing needs. Increasing shelter capacity may help more people access immediate protection, but temporary accommodation does not necessarily provide a permanent housing solution.
HUD also notes that counting unsheltered people is difficult. Some individuals may be missed because they are in locations that outreach teams cannot easily reach or because local communities have different resources for conducting counts.
As a result, the number of people experiencing unsheltered homelessness may be higher than the reported estimate.
Why the January 2024 Count Needs Context
Point-in-time counts are useful for understanding the scale and distribution of homelessness, but they have limitations.
First, they represent one night rather than an entire year. People can move into and out of homelessness over time, so the snapshot does not capture every person who experiences housing instability during the year.
Second, the count depends on local data collection. Differences in outreach methods, shelter access, and local reporting practices can affect the results.
Third, conditions change. The 2024 figures describe circumstances in January 2024, not necessarily the situation in a state today. Housing costs, disasters, public programs, and local responses may have changed since the count was conducted.
For these reasons, the figures are most useful when combined with other evidence, including housing costs, shelter availability, eviction trends, and later homelessness reports.
What Can Communities Do?
Responding to homelessness requires more than counting the people affected. Communities need approaches that address both immediate safety and long-term housing stability.
Emergency shelters and outreach services can help people access protection and essential support. Rental assistance, eviction prevention, affordable housing development, and rapid rehousing programs can help people avoid losing their homes or move into stable accommodation.
People who face long-term homelessness may also need permanent supportive housing and coordinated services.
The most appropriate response depends on local conditions. Reliable data can help governments and service organizations identify needs, evaluate existing programs, and decide where additional resources may be useful.
No single map can explain every person’s circumstances, but accurate statistics can help communities ask better questions and make more informed decisions.
Frequently Asked Questions
1. How many people experienced homelessness in the United States in 2024?
HUD counted 771,480 people experiencing homelessness on a single night in January 2024.
2. Which states recorded the highest numbers?
California recorded 187,084 people and New York recorded 158,019, the two largest state totals in HUD’s 2024 report.
3. Does the point-in-time count include people in shelters?
Yes. It includes people in emergency shelters, safe havens, and transitional housing, as well as people experiencing unsheltered homelessness.
4. Does the count represent everyone who experienced homelessness during 2024?
No. It is a one-night estimate, not a count of everyone who experienced homelessness at any time during the year.
5. Where can readers find the original data?
Readers can consult HUD’s 2024 Annual Homelessness Assessment Report for national findings, state estimates, definitions, and methodological notes.
Conclusion
The 2024 homelessness data reveal a nationwide challenge with significant differences between states. California and New York recorded the largest numbers, while population-adjusted rates provide another perspective on the scale of the issue.
The most important lesson is to read the figures carefully. Total counts, population rates, and unsheltered percentages answer different questions, and a one-night snapshot cannot describe every experience of homelessness.
Accurate data, combined with effective local services and long-term housing solutions, can help communities better understand the problem and work toward greater housing stability.