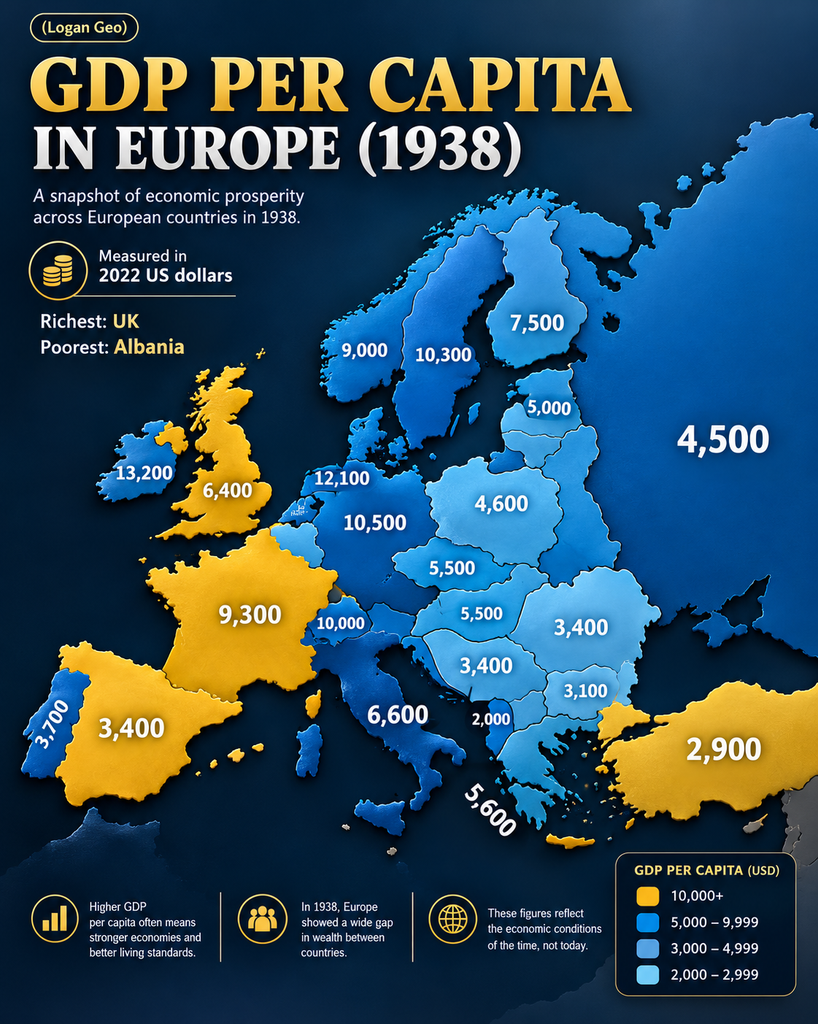
In 1938, Europe stood at a turning point in its history. Some countries had highly developed industries, extensive trading networks, and relatively high economic output per person. Others depended more heavily on agriculture and had much lower levels of measured economic production.
A historical map of GDP per capita offers an interesting way to explore these differences. However, understanding Europe’s economy before World War II requires more than comparing numbers on a map. It also means examining industrial development, trade, living standards, and the limitations of historical statistics.
What Does GDP Per Capita Mean?
Gross domestic product, or GDP, measures the value of final goods and services produced within a country’s borders during a particular period. GDP per capita divides that total by the country’s population.
Economists use this measure to compare average economic output between countries of different sizes.
For example, a country with a large population may produce more in total than a smaller country while still having lower GDP per person. Per-capita figures help reveal this distinction.
However, GDP per capita is not the same as the average salary. It does not show how income is distributed, how much wealth households own, or whether everyone enjoys similar living conditions. It is one useful indicator of economic performance, not a complete measure of prosperity.
For historical comparisons, researchers also adjust figures for differences in purchasing power and prices. These adjustments help make comparisons more meaningful across countries and periods.
Which European Economies Were Wealthy in 1938?
Historical estimates from the Maddison Project Database provide a useful reference for understanding Europe’s economic position before the war.
In its 1938 series, measured in constant 2011 international dollars, the United Kingdom had an estimated GDP per capita of approximately $9,988. Switzerland followed at about $9,609, while Denmark recorded approximately $9,185. The Netherlands stood at roughly $8,368, and Germany at about $7,960.
These figures illustrate that several northwestern European economies had relatively high levels of output per person. They also show why a historical map should be checked against its underlying dataset before its rankings are repeated as fact.
The figures are historical estimates, not exact measurements of every person’s income. They should be interpreted using the methodology and price basis of the dataset from which they come.
Source: Maddison Project Database 2023, as presented in the historical 1938 dataset.
Why Were Some Countries More Economically Developed?
Industrialization and manufacturing
Industrialization played a major role in Europe’s economic differences. Countries with extensive manufacturing industries could produce large quantities of machinery, textiles, chemicals, metal products, and other goods.
Industrial production could generate economic value beyond what traditional agriculture alone could provide. It also supported employment in transportation, banking, engineering, and other services.
Britain had industrialized early and developed substantial manufacturing and commercial networks. Germany had also become a major industrial power, with important chemical, engineering, and machinery industries.
These advantages helped support higher economic output, although countries’ experiences varied by sector, region, and population.
Trade and international connections
International trade was another important factor. Ports, railways, shipping networks, and commercial relationships helped businesses obtain raw materials and sell products in overseas markets.
Countries with strong trading connections could specialize in particular industries and access larger markets than their domestic populations alone would provide.
Geography mattered, too. Access to navigable waterways, ports, and neighboring markets could influence the cost of moving goods and the development of industrial centers.
Trade was not the only explanation for prosperity, however. Institutions, investment, education, resources, and historical circumstances also influenced economic performance.
Agriculture and economic structure
Agriculture remained important across much of Europe in 1938. In countries where a large share of the population worked in farming, average measured output could differ considerably from that of highly industrialized economies.
Agricultural productivity depended on land quality, technology, infrastructure, investment, and access to markets. Rural poverty could persist even where a country produced valuable agricultural goods.
This distinction helps explain why European countries did not share one common economic experience. The continent contained a wide variety of production systems and levels of industrial development.
Europe in 1938: A Continent Approaching War
The year 1938 was especially significant because Europe was experiencing a major political and military crisis.
Nazi Germany annexed Austria in March 1938. In September, the Munich Agreement permitted Germany to annex the Sudetenland, a region of Czechoslovakia. These events formed part of the escalating crisis that preceded the outbreak of World War II in September 1939.
Political uncertainty and rearmament influenced economic priorities in several countries. Government spending on military equipment could stimulate particular industries, but it did not necessarily mean that ordinary households enjoyed greater prosperity.
It is therefore important to separate a country’s economic output from the welfare of its population. An economy producing more military equipment or industrial goods could register substantial production without distributing its benefits evenly.
Europe’s economic map captures only one dimension of this complicated historical moment.
What Can a Historical Economic Map Tell Us?
A well-researched map can make complex economic information easier to understand. By placing figures beside countries, it allows readers to compare broad patterns without having to examine a lengthy spreadsheet.
It can help identify differences between industrial centers and less industrialized economies, encourage questions about trade and development, and provide a starting point for further historical research.
But maps simplify reality.
Country borders have changed over time, and modern names or boundaries do not always match the political geography of 1938. Historical datasets may also use reconstructed estimates because complete national accounts did not exist in the same form as they do today.
Currency and price adjustments matter as well. A figure expressed in 2011 international dollars cannot automatically be treated as a value in 2022 US dollars. The conversion method and underlying source must be stated clearly.
For these reasons, the map’s specific numbers and rankings should not be accepted without checking the original data.
Did Higher GDP Per Capita Mean Better Living Standards?
Higher GDP per capita generally indicates greater average economic output, but it does not guarantee that every resident was wealthy or secure.
Living standards also depended on wages, employment, prices, housing, healthcare, education, social protection, and access to essential goods.
Two countries with similar GDP-per-capita estimates could have very different levels of inequality or social welfare. Even within one country, the experiences of industrial workers, farmers, business owners, and wealthy households could differ greatly.
Historical comparisons should therefore combine economic estimates with evidence about how people actually lived.
GDP per capita remains valuable because it provides a consistent starting point. It becomes more informative when used alongside other historical and social indicators.
Frequently Asked Questions
1. What was GDP per capita in 1938?
GDP per capita was the value of a country’s economic production divided by its population. Historical researchers reconstruct estimates for 1938 using national records and other evidence. The result depends on the dataset and its methodology.
2. Which European country had the highest GDP per capita in 1938?
In the cited Maddison Project Database 2023 series, the United Kingdom had a higher estimated GDP per capita than the other European countries listed here, at approximately 9,988 in constant 2011 international dollars. Rankings can vary with dataset coverage and methodology.
3. Was GDP per capita the same as average income?
No. GDP per capita measures average economic output per person, not the amount each person earned. It does not reveal how income or wealth was distributed.
4. Why are historical GDP figures estimates?
Modern statistical systems did not exist in their current form in 1938. Researchers use surviving records, historical studies, population estimates, and economic models to reconstruct national output. Some uncertainty is unavoidable.
5. Can 1938 GDP figures be compared directly with today’s figures?
Only with appropriate adjustments and careful attention to the data source. Inflation, purchasing power, national boundaries, population, and changes in economic measurement all affect comparisons across time.
Conclusion
Europe’s economic landscape in 1938 reflected decades of industrialization, trade, agricultural development, and unequal economic growth. Historical estimates show that countries such as the United Kingdom and Switzerland had relatively high output per person, while economic development differed considerably across the continent.
Yet a map cannot tell the whole story. GDP per capita is not the same as household income, and historical estimates require consistent units and transparent sources.
The most useful way to read a map of Europe’s prewar economy is as an invitation to investigate further: which industries drove prosperity, why economic differences emerged, and how the continent’s development was affected by the events that followed.
Sources for further reading
- Groningen Growth and Development Centre, Maddison Project Database 2023.
- Our World in Data, GDP per capita: Maddison Project Database.
- Historical GDP per capita data for 1938, Maddison Project Database series.