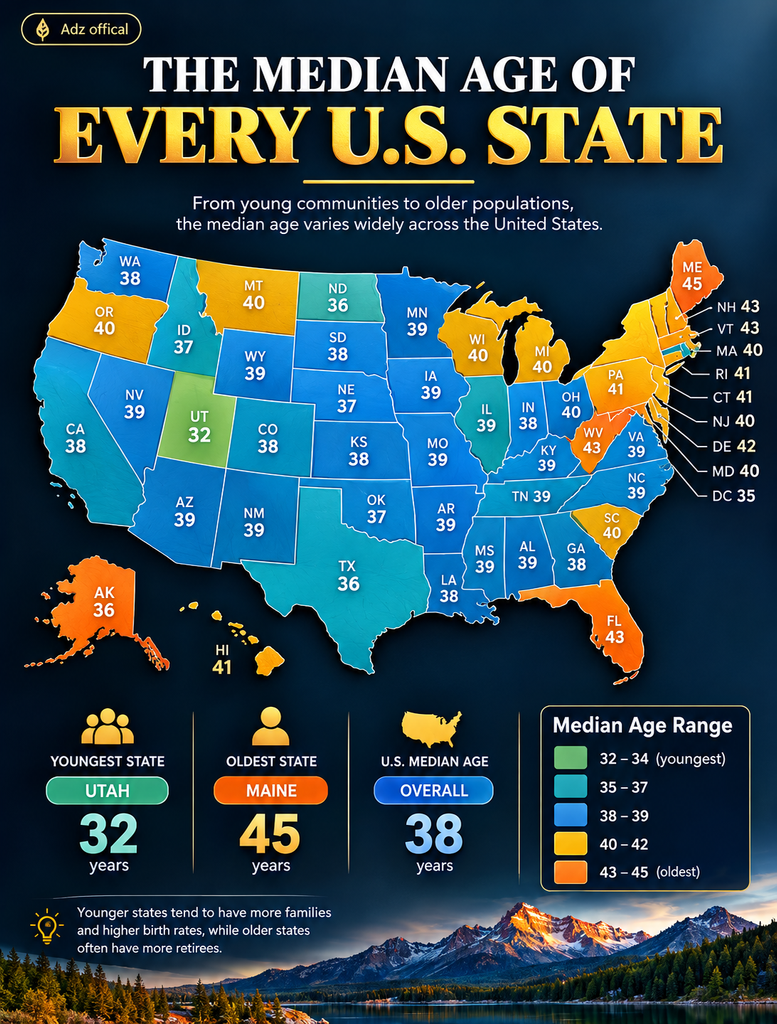
The United States is one country, but its population looks very different from state to state. Some states have relatively young populations, while others have a much larger share of older residents. A map of median age makes these differences easy to see—and raises an important question: why does the age of the population vary so much across America?
The answer involves more than birth rates. Migration, retirement destinations, employment opportunities, universities, and changes in life expectancy all help shape a state’s age profile.
What Does Median Age Actually Mean?
Median age is the age that divides a population into two equal groups. Half of the population is younger than the median, and half is older.
For example, if a state has a median age of 40, approximately half its residents are younger than 40 and half are older. It does not mean that most people are exactly 40 years old.
This measure is useful because it summarizes the overall age structure of a population in a single number. Researchers use it to compare places, study demographic changes, and understand how communities may need to adapt over time.
According to the U.S. Census Bureau’s 2022 population estimates, the national median age reached 38.9 years. That same year, Maine had the highest median age among the states at 44.8, while Utah had the lowest at 31.9. Texas was also among the youngest states, with a median age of 35.5. Source: U.S. Census Bureau
Why Utah Has One of America’s Youngest Populations
Utah stands out for its comparatively young population. Several demographic factors help explain this pattern.
One important factor is the state’s age structure. Utah has historically had relatively high fertility rates compared with many other states, contributing to a larger proportion of children and young families.
The Census Bureau’s 2022 estimates reported that 27.6% of Utah’s population was under age 18. A relatively large share of children and younger residents helps keep the median age down.
Utah is also home to universities, growing employment centers, and communities that attract families and working-age adults. These factors can influence the number of younger residents, although their effects vary by location.
It is important not to assume that every person in Utah is young or that every community follows the same pattern. The median age is a statewide measure that can hide substantial differences between counties and cities.
Why Maine Has America’s Oldest State Population
Maine presents a different demographic picture. In 2022, its median age was 44.8, the highest among the states.
One reason is the relative share of older residents. When people live longer and younger age groups make up a smaller proportion of the population, the median age tends to rise.
Migration can also contribute. Some people move to Maine for retirement, quality of life, or family connections. At the same time, younger adults may leave certain communities to pursue education or employment elsewhere.
These patterns can create challenges for local economies, especially when communities need enough workers to support health care, businesses, and public services.
However, an older population is not automatically a disadvantage. Older residents contribute experience, community involvement, spending, and family support. The practical effects depend on local economic conditions, available services, and the balance between age groups.
Why Texas Is Also Relatively Young
Texas combines a large population with a comparatively young age profile.
The state has major employment centers, universities, growing metropolitan areas, and a history of attracting residents from other parts of the United States and abroad.
Migration can influence the median age when a state attracts substantial numbers of younger adults and families. Births also matter: a larger proportion of children can lower the overall median even if the state has many older residents too.
Texas is not uniformly young, however. Large cities, rural communities, university towns, and retirement destinations can have very different demographic characteristics.
This illustrates why a state-level map is useful for broad comparisons but cannot tell the whole story about individual communities.
The Role of Migration and Retirement
Population movement is one of the biggest reasons states develop different age profiles.
Young adults often move for college, jobs, affordable housing, or family opportunities. Their arrival can lower a community’s median age, particularly if they bring children or begin families.
Retirement migration can have the opposite effect. When older adults move into an area in large numbers, the local median age may rise.
Florida offers a notable example. It is well known as a retirement destination, but the age structure differs greatly between its counties.
In 2022, Sumter County, Florida, recorded a median age of 68.1 years, the highest among U.S. counties and county equivalents in the Census Bureau’s estimates. The county includes The Villages, a large retirement-oriented community. Source: U.S. Census Bureau
This figure describes the county’s population as a whole, not the age of every resident or every person living in Florida.
Why Median Age Matters for Local Communities
Age demographics affect the kinds of services communities may need.
Places with large numbers of children and young families may need additional schools, childcare, parks, and family services. Communities with more older residents may require more accessible transport, health care, suitable housing, and support for people who want to remain independent as they age.
The working-age population also matters. Businesses need employees, while state and local governments rely on residents and economic activity to fund public services.
These connections are not simple predictions. A higher median age does not automatically mean a community is declining, just as a lower median age does not guarantee economic growth. Education, wages, housing costs, infrastructure, and migration all play important roles.
Is America’s Population Getting Older?
Broadly, yes. The Census Bureau reported that the national median age increased to 38.9 in 2022, up from 38.7 in 2021.
The agency linked the trend to factors including declining birth rates and the aging of large generations, such as the Baby Boom generation.
However, population aging does not occur at the same pace everywhere. Some states have younger age structures, while others have larger proportions of older adults. Migration and differences in fertility patterns contribute to those variations.
It is also important to distinguish a historical map from current statistics. The image describes 2022, so it should not be used to claim that the same state rankings or figures apply today. More recent Census Bureau estimates are available for readers who want to compare the latest data.
Frequently Asked Questions
1. Which U.S. state had the youngest population in 2022?
Utah had the lowest median age among the states in 2022, at 31.9 years, according to the U.S. Census Bureau.
2. Which state had the oldest population in 2022?
Maine had the highest state median age in 2022, at 44.8 years.
3. What was the median age of the United States in 2022?
The national median age was 38.9 years, based on the Census Bureau’s 2022 population estimates.
4. Why do retirement destinations often have higher median ages?
When many older adults move into an area, they increase the proportion of older residents. This can raise the median age, particularly if the community has relatively fewer children and young adults.
5. Does a higher median age mean a state is less successful?
No. Median age describes the age structure of a population, not a state’s overall success. Economic opportunity, health, education, quality of life, and many other factors must also be considered.
Conclusion
America’s median age map reveals how different state populations can be, even within the same country. Utah’s comparatively young population, Maine’s older age profile, Texas’s large younger population, and Sumter County’s high median age each reflect different combinations of births, migration, and local community characteristics.
The key lesson is that age demographics are shaped by many forces working together. A single number cannot explain everything about a state, but it provides a useful starting point for understanding how American communities change over time.
Looking beyond the colors on the map helps turn a simple comparison into a clearer picture of the people, families, and demographic trends shaping the United States.