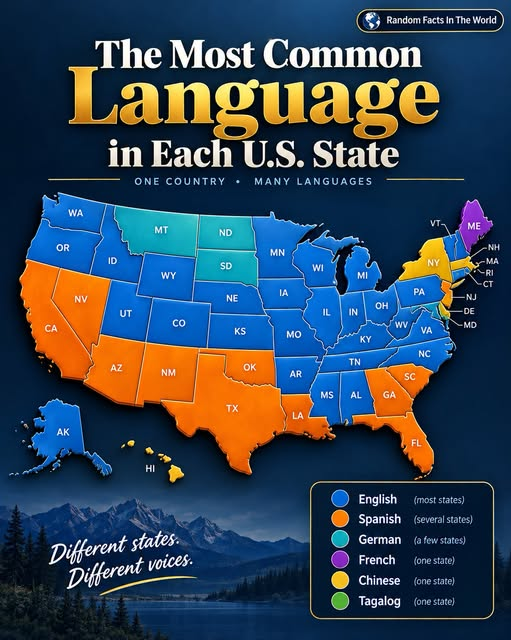
The United States is home to hundreds of languages, reflecting generations of migration, Indigenous heritage, and cultural exchange. Although English is the most widely spoken language at home, millions of Americans communicate with their families in other languages every day.
A color-coded map of languages across the country offers an interesting starting point for exploring this diversity. However, to understand what the map really tells us, it is important to compare its claims with reliable demographic research.
According to the U.S. Census Bureau’s American Community Survey (ACS), language use varies considerably across the country. Spanish is the most common language other than English in nearly every state, while Alaska, Hawaii, and parts of the Northeast have distinctive language patterns. Source: USAFacts.
How Many Americans Speak a Language Other Than English?
The United States is more linguistically diverse than many people realize.
According to 2024 American Community Survey data analyzed by the Migration Policy Institute, approximately 73 million residents aged five and older spoke a language other than English at home. Spanish accounted for roughly 44.8 million of those speakers.
Chinese, including Mandarin and Cantonese, ranked second nationally among non-English languages, followed by Tagalog, Vietnamese, Arabic, and French.
These figures refer to language spoken at home, not necessarily a person’s only language. Many people who speak another language with family also speak English fluently.
This distinction matters because a language map does not necessarily show which language people know best, which language they use at work, or which language they use in public.
Why Is Spanish So Widespread Across the United States?
Spanish has deep historical and cultural roots in America. Spanish-speaking communities existed in parts of what is now the United States long before the country’s modern borders were established.
Over time, migration, family connections, trade, and population growth helped Spanish become widely spoken throughout the country.
Today, Spanish-speaking communities can be found in large cities, small towns, rural communities, and suburbs. The language is particularly visible in states such as California, Texas, Florida, Arizona, and New Mexico, although its presence extends far beyond these areas.
The large number of Spanish speakers reflects a combination of historical settlement, immigration from Latin America and the Caribbean, and generations of families maintaining their language.
It is also important to remember that speaking Spanish does not indicate a person’s citizenship, birthplace, or level of English proficiency. Spanish speakers include immigrants, U.S.-born residents, bilingual families, and people with many different backgrounds.
What Makes Alaska Different?
Alaska has a distinctive linguistic history shaped by its Indigenous peoples and communities.
Native languages, including languages in the Eskimo-Aleut language family, remain an important part of Alaska’s cultural heritage. Central Yup’ik is one example of an Indigenous language spoken in the state.
These languages carry knowledge, traditions, place names, and cultural connections that extend across generations.
However, Indigenous language communities face different challenges, including language loss and the need for continued teaching and revitalization. The Census Bureau has documented the use of Native North American languages in its language statistics.
A map that labels Alaska with a single language can simplify a much more complex reality. Many languages are spoken across the state, and no single label captures every community.
Why Does Hawaii Have a Different Language Pattern?
Hawaii’s language diversity reflects its Indigenous heritage and a long history of migration from the Pacific and Asia.
Hawaiian is central to the islands’ Indigenous cultural identity. Other languages, including Ilocano, Tagalog, Japanese, and Samoan, are also part of Hawaii’s diverse linguistic landscape.
The language that appears as the leading non-English language can depend on the data source, the years being measured, and how languages are grouped together.
For example, the Census Bureau’s 2017–2021 detailed language tables identified Iloko as Hawaii’s most common non-English language, followed by Tagalog and Japanese. Other analyses using different periods or groupings may report broader categories.
This is why a reliable map should include its data source and reference period instead of presenting language rankings as timeless facts.
What About French in Maine and Vermont?
French has a long history in parts of the northeastern United States, particularly in communities connected to French Canada.
Maine’s proximity to Quebec and New Brunswick has contributed to longstanding French-speaking communities. Cross-border family ties, migration, and regional history have helped preserve the language.
Vermont also has historical connections to French-speaking communities, although the exact ranking of languages can vary with the data period and statistical method.
The Migration Policy Institute’s analysis of pooled 2020–2024 ACS data identifies French as the most common language other than English in both Maine and Vermont. Other summaries using different estimates may produce slightly different state-level comparisons.
These differences illustrate an important lesson: even reputable demographic analyses can differ when they use different language categories or statistical methods.
Are the Other Languages on the Map Accurate?
The supplied infographic uses colors to associate states with Spanish, Gujarati, French, German, Tagalog, and Yupik.
Some of these language choices may reflect genuine communities or regional history. But the map’s assignments should not automatically be accepted as a complete or accurate ranking.
For instance, the infographic highlights German in North Dakota and Gujarati in parts of the Northeast. Those languages are certainly spoken in the United States, but the fact that a community speaks a language does not establish that it is the most commonly spoken non-English language in a particular state.
Recent Census-based research finds that Chinese is the leading non-English, non-Spanish language in 13 states, while German is prominent in eight states and French in six, according to the Migration Policy Institute’s analysis of 2020–2024 data.
The map would need to be checked state by state against a defined dataset before being published as a factual ranking.
Readers should also distinguish between a map showing the second-most-spoken language overall and a map showing the most common language after excluding both English and Spanish. Those are two different questions and can produce very different results.
What Do Language Maps Tell Us About American Culture?
Language maps help explain how geography, migration, and history shape communities.
A language can remain strong in a region because families pass it down, schools teach it, cultural organizations support it, or neighbors use it in everyday life.
Languages also travel. People move for education, employment, family, and safety, bringing their languages with them. Over time, new communities develop while older traditions continue.
Language diversity can influence local businesses, schools, public services, broadcasting, literature, food, and community events. It can also create opportunities for people to learn from cultures different from their own.
Yet a state-level map has limitations. A single color may hide substantial differences between cities and rural areas, and the most common language in a state may not be the most common language in every neighborhood.
Frequently Asked Questions
1. What is the most common language spoken in the United States after English?
Spanish is the most common non-English language spoken at home in the United States, with approximately 44.8 million speakers aged five and older in 2024, according to Migration Policy Institute analysis of Census Bureau data.
2. Which states have distinctive non-English language patterns?
Alaska, Hawaii, and Maine stand out in recent state-level summaries. Some analyses also identify Vermont because of its French-speaking population. The precise exceptions depend on the dataset and how languages are grouped.
3. Does speaking a language at home mean someone cannot speak English?
No. Many people who speak another language at home also speak English very well. Census surveys ask separately about the language spoken at home and a person’s ability to speak English.
4. Why do different language maps show different results?
Maps may use different years, surveys, language categories, or definitions. Some exclude only English, while others exclude both English and Spanish. These methodological differences can change the rankings.
5. Where can I find reliable U.S. language statistics?
The U.S. Census Bureau’s Language Use Data page provides information and links to statistics on languages spoken at home and English proficiency.
Conclusion
America’s language map tells a story that goes beyond state borders. Spanish connects millions of households, French reflects longstanding regional ties, and Indigenous languages preserve cultural traditions that have existed for generations.
The most important takeaway is that the United States does not have one simple language pattern. Each region has its own history, and every state contains more linguistic diversity than a single color can show.
A useful language map should do more than attract attention. It should help readers understand the communities behind the data, while making its sources and limitations clear.